VIX - Volatility Forecast Model

The VIX, or the CBOE Volatility Index, is a financial indicator that tries to measure how much the stock market is expected to move in the near future, specifically over the next 30 days. It focuses on the S&P500, one of the stock market indexes that includes 500 of the largest companies in the U.S. and is often considered a good representation of the overall U.S. economy.
First of all, "volatility" in financial markets refers to the degree of variation of trading price series over time. Higher volatility means that the price can change dramatically in a short period. Low volatility means that the price changes are more gradual.
Fear
VIX is often called the "fear index" or "fear gauge" because it tends to rise when market participants are uncertain or worried. When market participants are less certain about the future and expect more volatility (more ups and downs with magnitude). That's why a high VIX often correlates with a market decline. However, this is not always the case.
However
The VIX is calculated using the prices of options on the SPX500 index. We all know what options are at this point, and if you still don't, I recommend reading my educational articles about it.

When market participants expect high volatility, they're willing to pay more for options, which can act as a form of "insurance" against large moves with magnitude. Personally, I don't think that comparing it to insurance is great, but alright, that's what the textbooks say...
VIX rule of 16 (quick tip)
Have you heard about VIX Rule 16?
This enabled you to estimate a daily move
If, let's say the VIX is at 32
32/16 = 2
The market is pricing in a 2% move in the SPX500
If the VIX is at 14, you can do 14/16 = 0.875
The market is pricing in a move for 0.875% for that day in the SPX500
The article does not end here
Are, you a premium newsletter member but still haven't joined Discord?
(Also, the article does not end here)
Join Discord to get the full value out of the newsletter. There's no extra cost associated with Discord. Yes, options data, such as dark pools, options gamma, unusual flow, etc., are also included.


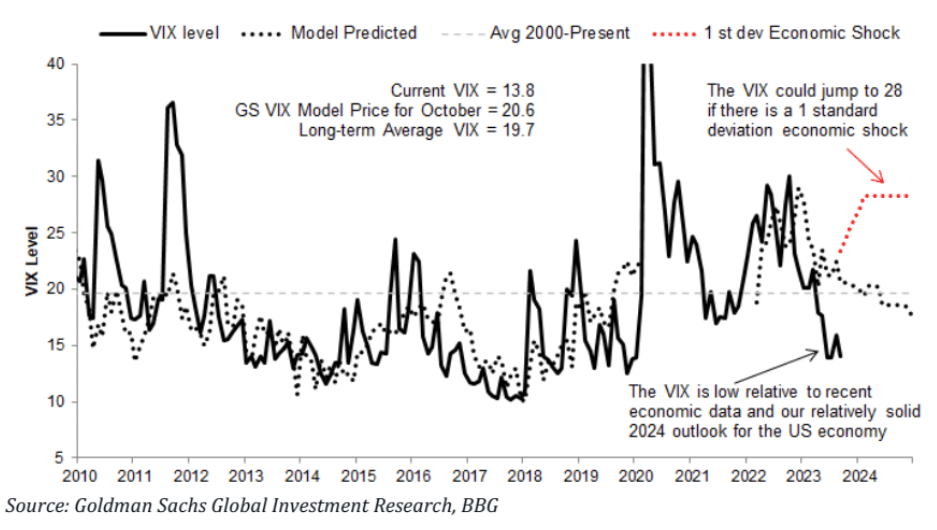
The VIX is currently at a low level, compared to its historical average and to the economic data
The VIX is low when you look at its past levels and also in the context of current economic indicators. A low VIX usually suggests that the market is not expecting a lot of volatility, which prompts market participants to sell calls & puts as they try to earn the premium (betting against volatility,).
The low VIX shows market participants are optimistic or perhaps even too relaxed (complacent) about the state of the market. Despite the various risks lurking behind the shadows, such as CPI this week, Oil prices ticking up, a surge in the dollar, and Tripple witching hours this week.
I wrote an older article about quadruple witching hours here. That one is Quadruple, however.

Not to forget all the potential risks that could disrupt the economy, like unexpected inflation, a mistake in policy by the Federal Reserve, or a sudden geopolitical event like a war.
If any of these risks materialize, the VIX could more than double and go up to 28, which is higher than its long-term average of 19.7.
Even without a major "shock", the VIX is likely to rise to 20 by October, according to Goldman Sachs's forecasting model. This model considers various economic indicators, like GDP growth, unemployment levels, inflation, and interest rates.

The model also considers how the VIX has behaved in the past during different economic cycles. Usually, the VIX is higher (or "elevated") during an economic downturn and lower during periods of economic growth.
Economic growth, I am skeptical about. It doesn't seem like the Federal Reserve will cut interest rates anytime soon, as they mentioned during their Jackson Hole speech "Higher for longer"


